OceanTrack - Data and Map - The MFD
The combined iPad DATA and MAP page
The Data:
The data displayed is real-time and from a selection of available sources; while some data is neary always available (position, COG and SOG for example, providing the device has these capabilities) and therefore shown, please note that some data is only available with the corresponding sensor equipment, an NMEA to WiFi server and the NMEA Connector inApp purchase add-on. Just like we can't live without oxygen, OceanTrak can't show wind speed or direction without a wind sensor and a way of feeding its readings into the app.


The split DATA and MAP pages on the iPhone
In its current version, and subject to being available, OceanTrack understands and displays the following performance indicators:
Based on the internal GPS / Location Services, NMEA, or AIS:
COG - Course Over Ground
SOG - Speed Over Ground
Based on an internal device compass, NMEA, same as course or AIS (if available, requires class A):
If NMEA is available + water / depth / log sensor:
DEP - Depth Below Keel
WTP - Water Temperature (iPhone only)
If NMEA is available + wind sensor and GPS for true measurements:
AWS - Apparent Wind Speed
TWA - True Wind Angle
TWS - True Wind Speed
Plus, calculated in relation to HDG:
BFT - Beaufort Direction / Force
The Map:
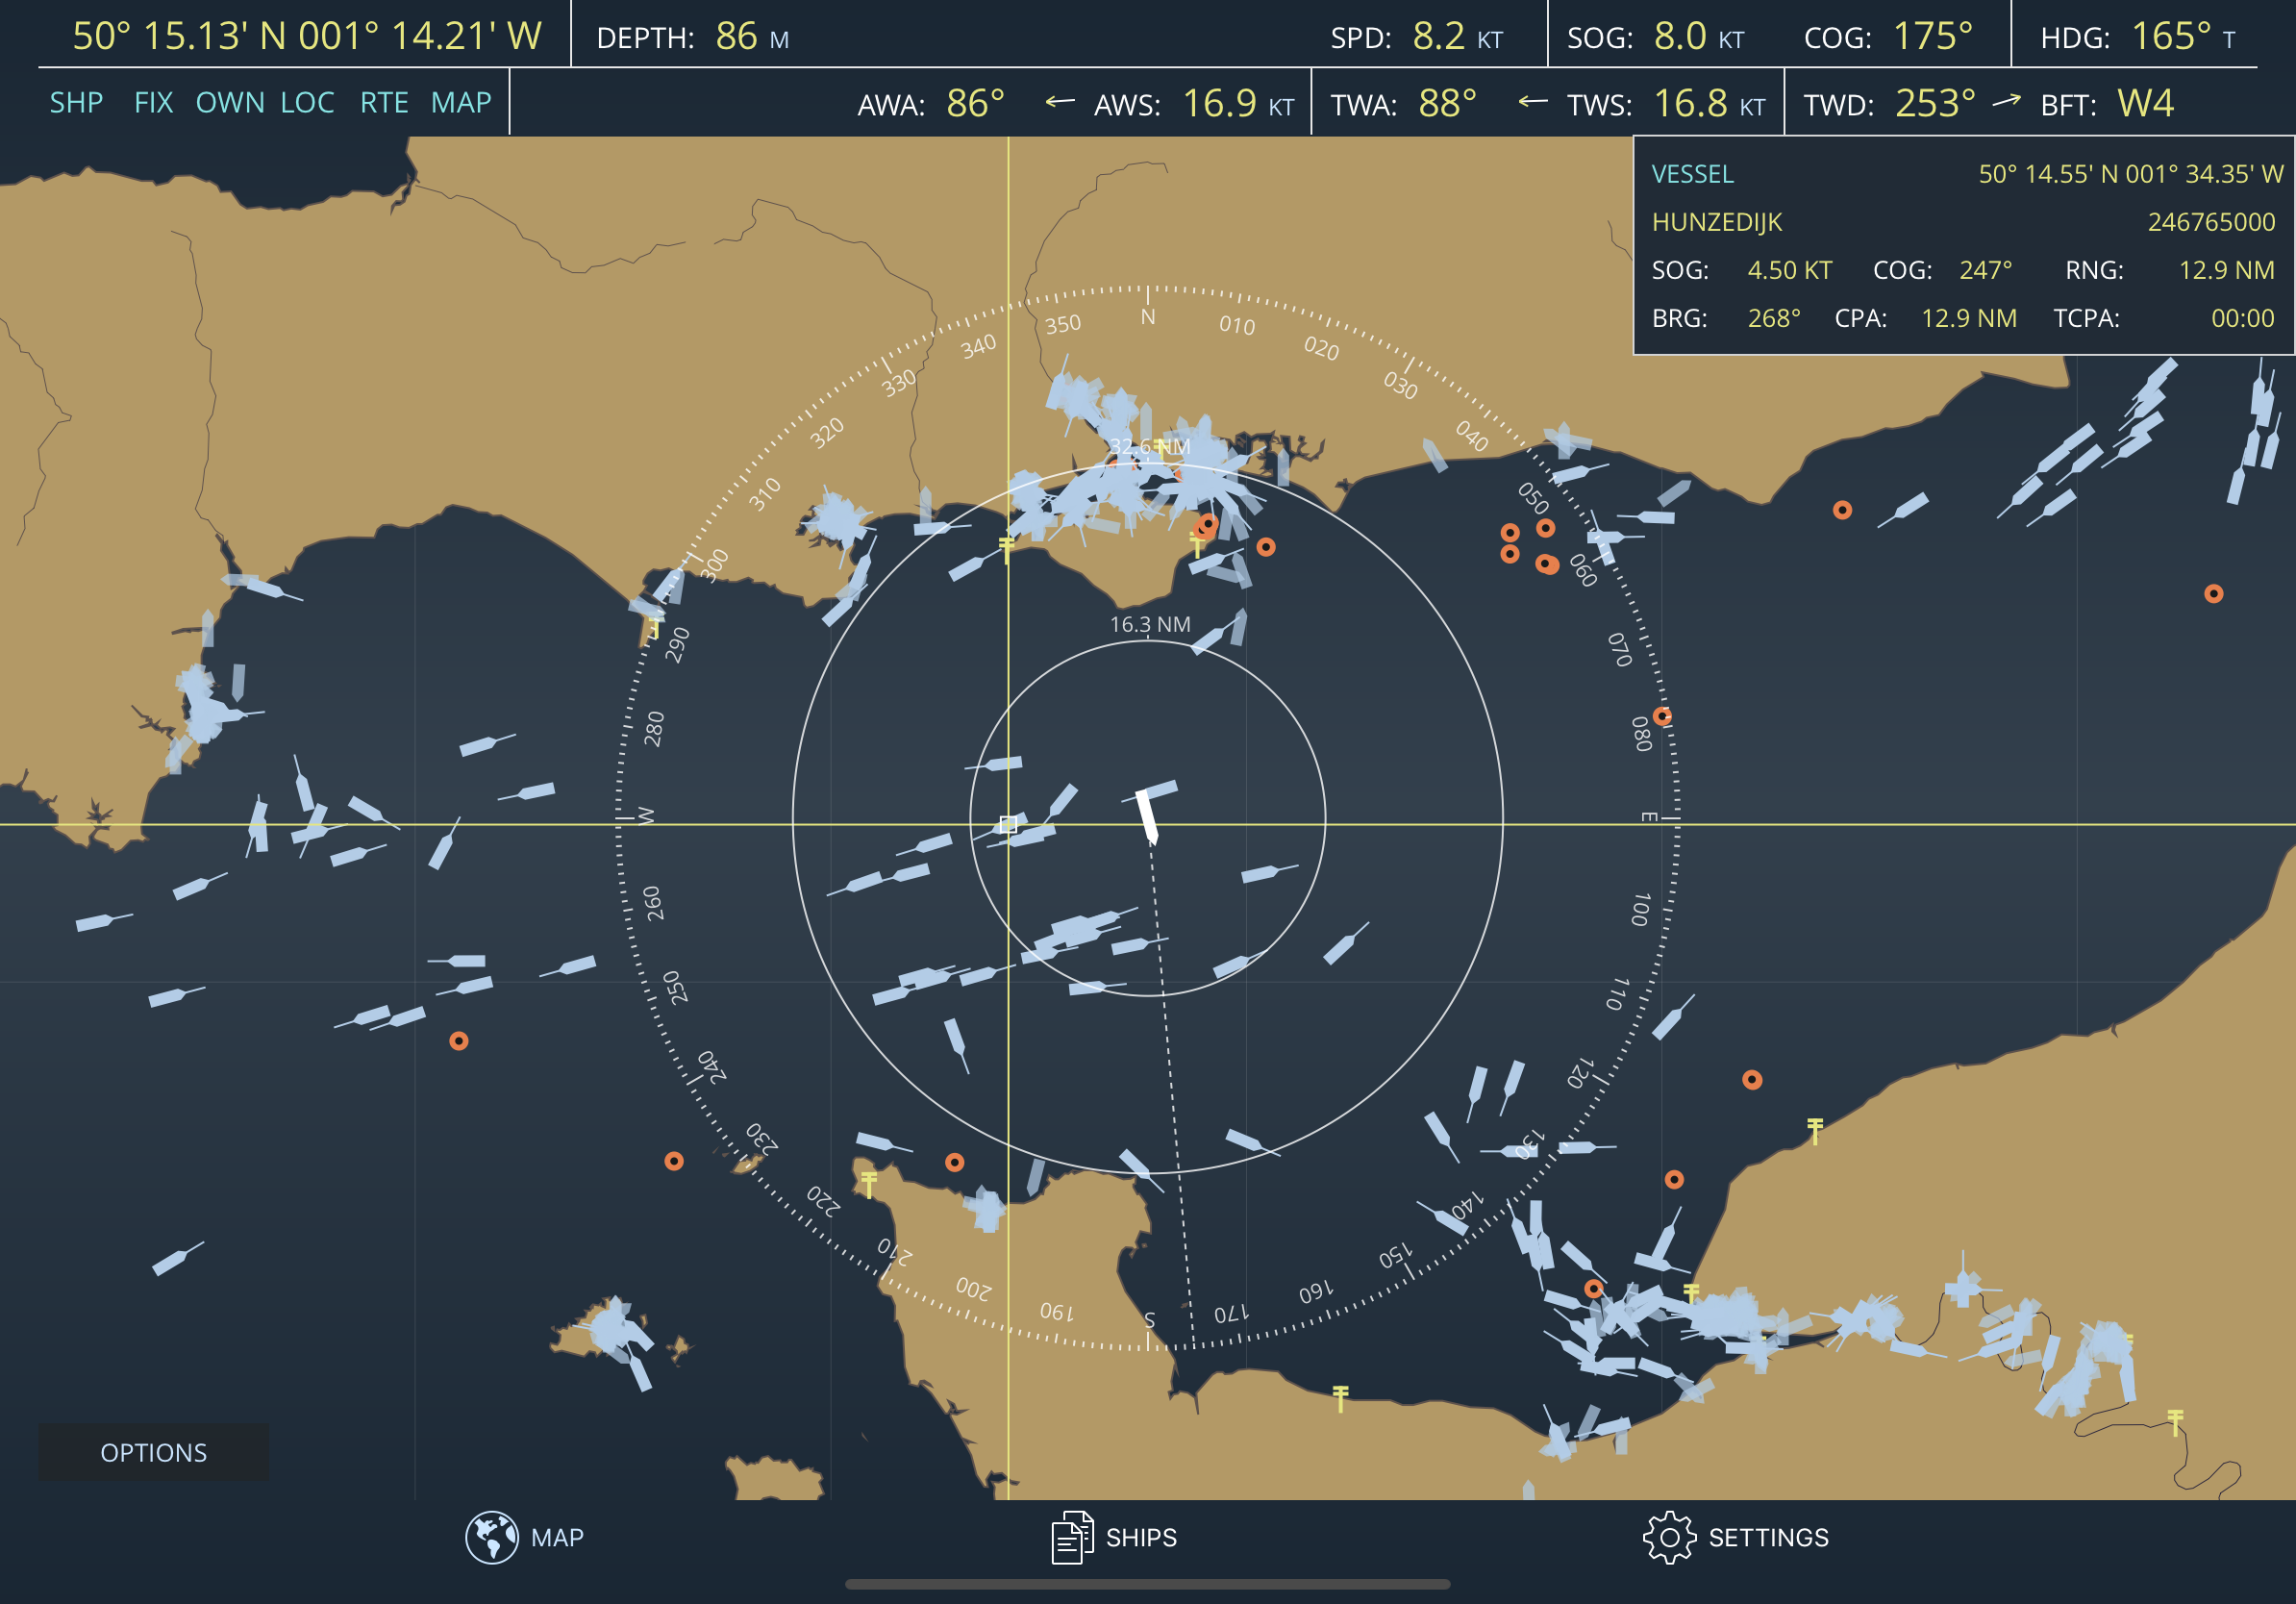
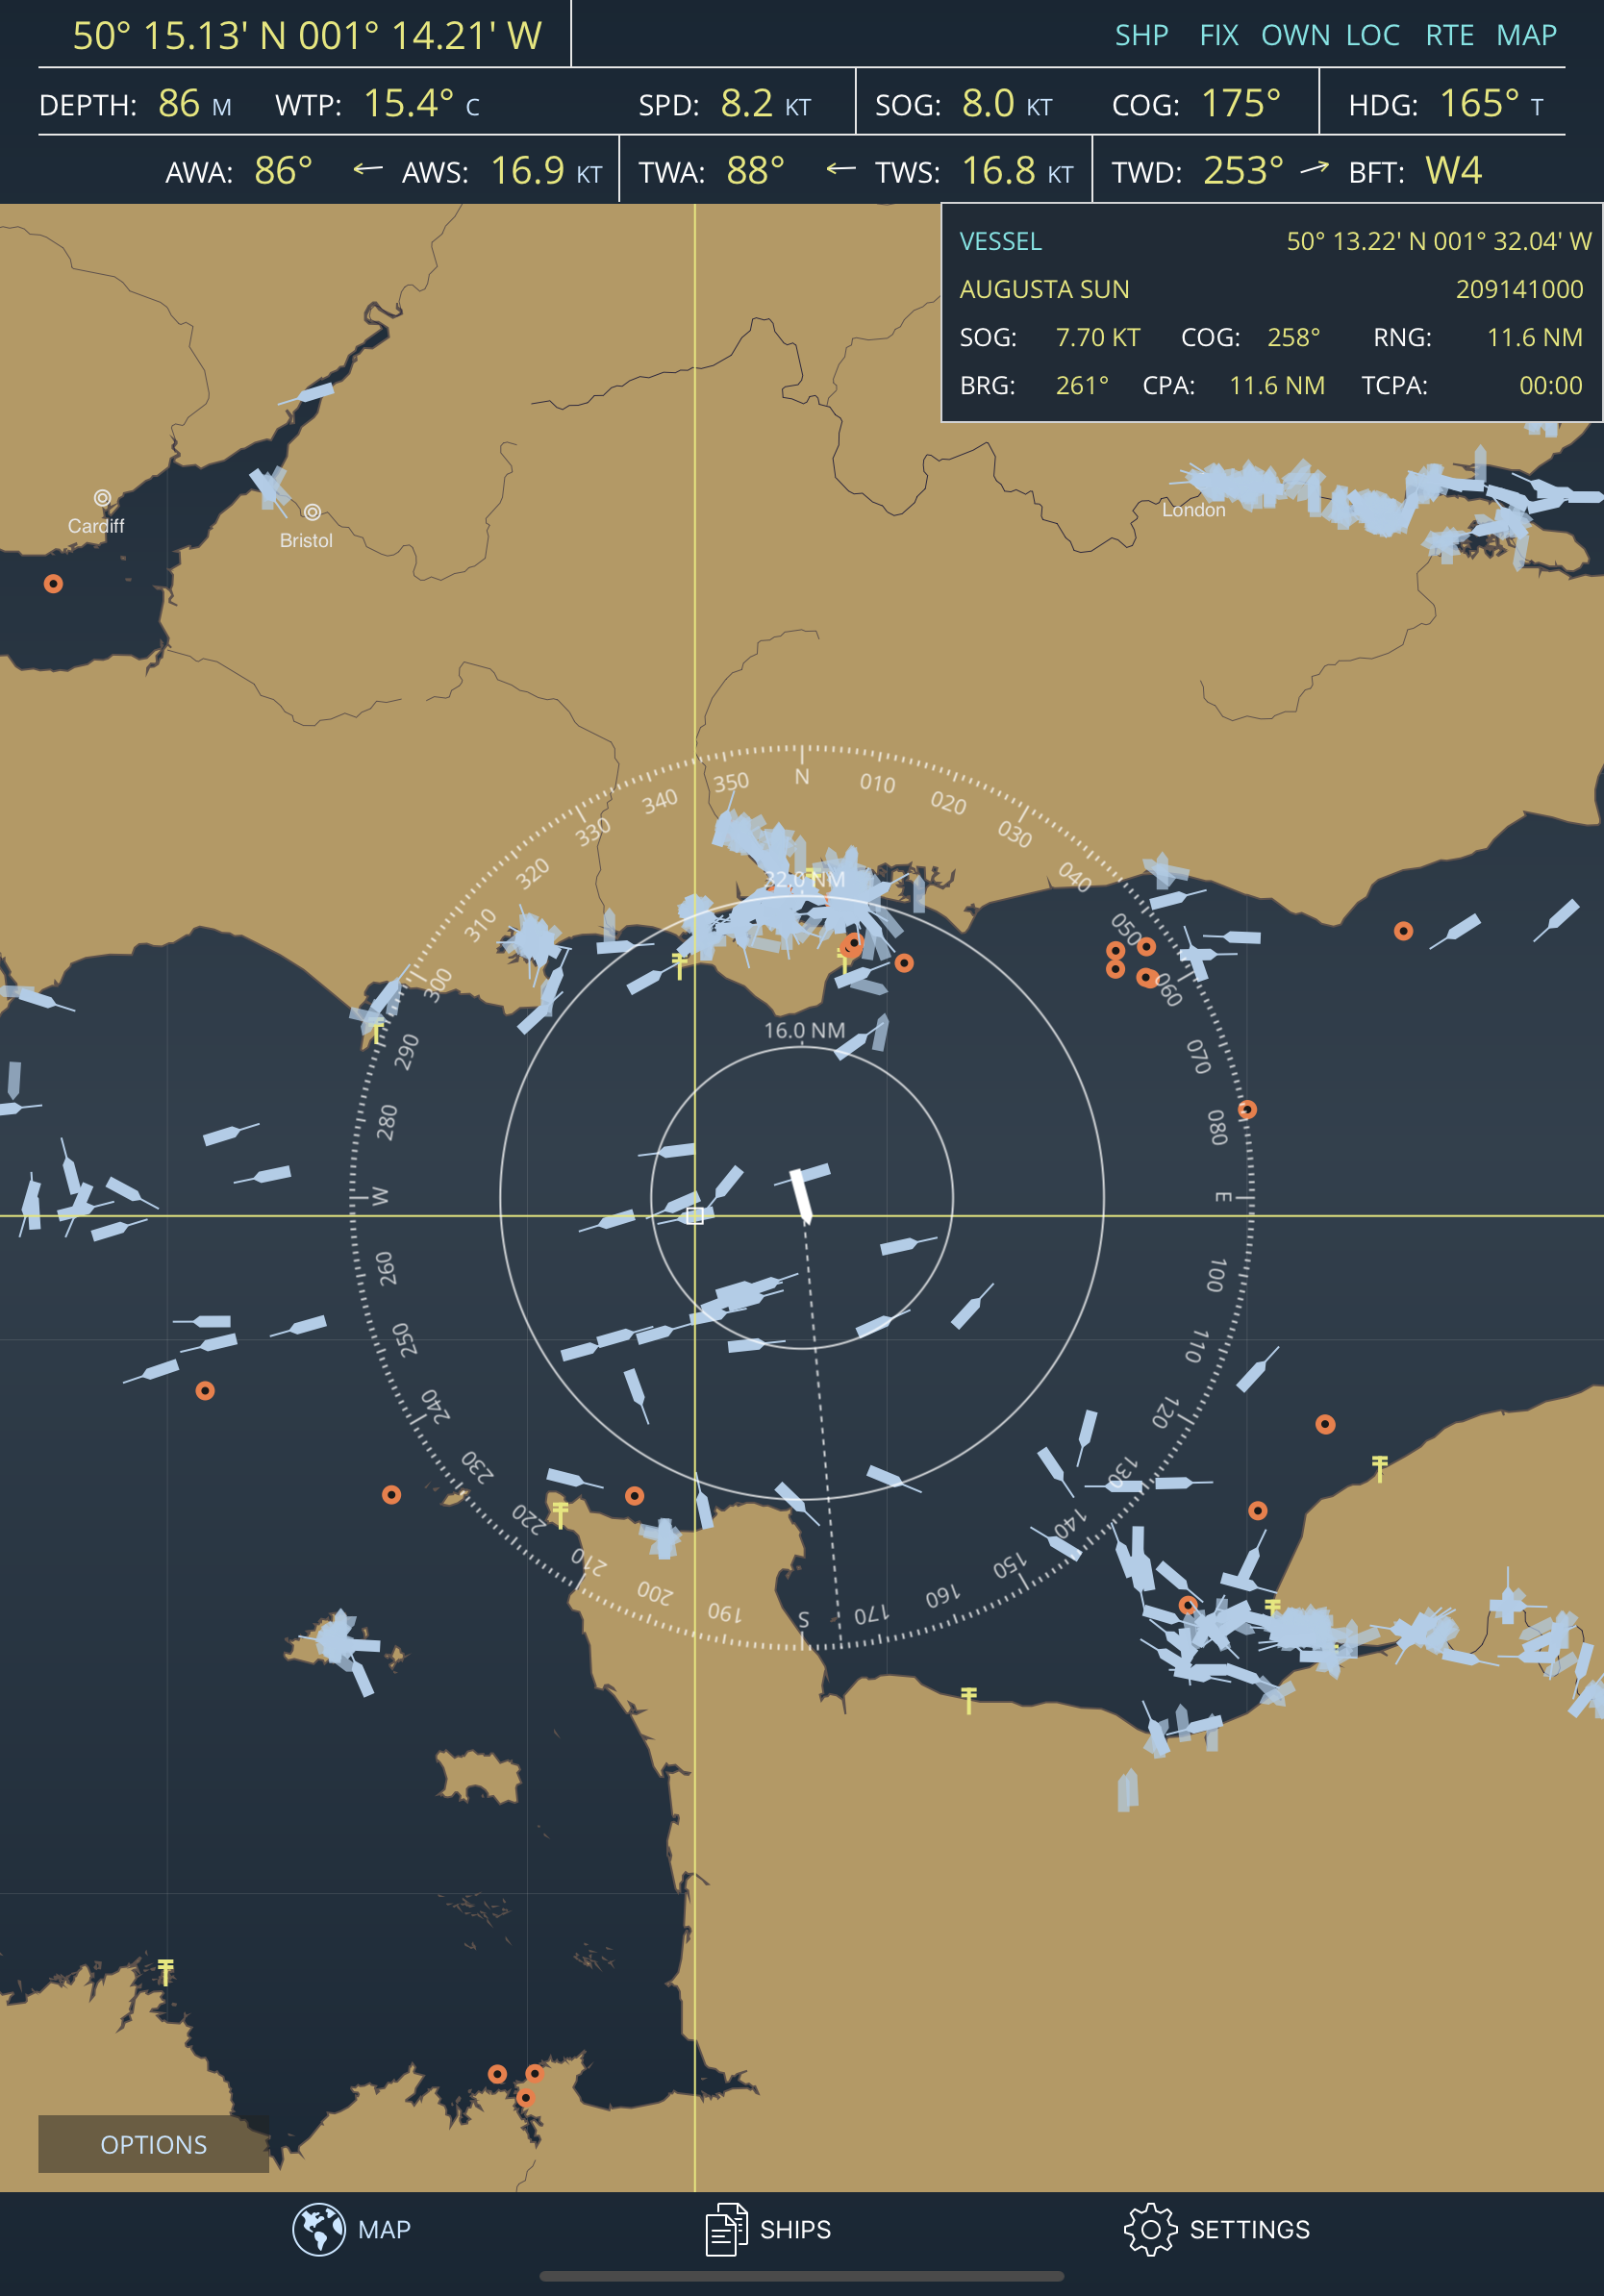
The map is displayed below enroute data on the iPad and on a separate page on the iPhone. When initially selected from the bottom tab bar the map is centered either on our current position or in a target if one has been selected.
The whole world is included. OceanTrack comes with embedded geo contour data for the whole planet, based on NOAA's Global Self-consistent Hierarchical High-resolution Shorelines, making it available even while offshore and without Internet.
Pinch finger gestures allow the map to be zoomed in or out; panning left, right, up or down allows the map to be moved east, west, south or north respectively. Tapping on any given location selects that particular point in the map as a target and opens up a target information widget containing relevant information about the target.
The MAP page on the iPad in Portrait orientation
The OPTIONS button leads to map configuration and allows different types of data to be selectively shown or hidden as desired.
Targets:
The blue boat shaped drawings represent vessel targets; due to cloud AIS, when connected to the Internet OceanTrack displays thousands of ships all around the world. Tapping on a ship reveals information about them on the target widget. It's COG, SOG, MMSI or NAME are included, as well as coordinates, CPA and TPA. Tapping on the target information widget itself takes the user to an even more detailed ship information page.
Tapping anywhere on sea or land shows that point's coordinates, RNG (range/distance from us), BRG (bearing from us) and ETE (at current speed). Distance and bearing are either orthodromic or loxodromic depending on settings.
Other types of targets include Base Stations (shown as yellow aerials), Navigation Aids (RACONS) shown as orange ballons, Search and Rescue Aircraft (shown as yellow and red planes) and Next Waypoint (shown in white only if a sailing plan exists and is being sent from the equipment via the NMEA connector). If present, information about the next waypoint includes VMG - Velocity Made Good, DTW - Distance to Waypoint, BTW - Bearing to Waypoint and XTE - Cross Track Error.
The current position is displayed by a white vessel symbol in the middle of the 3 compass circumferences which represent distance arc ranges (approximately due to projection distortion) with the corresponding distances shown on top. The white vessel faces the direction of heading (HDG) whereas the dotted line from it represents the course over ground (COG) and thus towards where it's actually moving.
CPA and TCPA:
Two indicators worth stressing out are CPA and TCPA. When crossing a busy area such as the English Channel, tap on a ship ahead that looks like being on a collision course to reveal details about it; based on our and their current speed and course, CPA shows the calculated closest point of approach i.e. the closest in distance we'll be from the other vessel. TCPA shows the time it will take us to reach that closest point at our current speed. In other words, these two numbers tell us if we'll cross at a safe distance and how long we have until then.

The world zoomed out - Tap anywhere
Next topic: AIS Ships